Recruitment Metrics: The 12 Numbers Every Hiring Team Should Track
 Tanmey Goswami
 ·Nov 11, 2026·10 min read

Key Takeaways
- 1Track 12 recruitment metrics in four groups: speed, funnel, offer and joining, and outcomes. Review funnel numbers weekly and outcomes quarterly.
- 2SHRM's 2026 Recruiting Executives Benchmarking, drawn from 4,600+ organisations, puts median time to fill at 39 calendar days for nonexecutive roles.
- 3SHRM's 2025 benchmarking puts average cost per hire at $5,475 for nonexecutive roles and $35,879 for executive roles in the US.
- 4In India, where one-to-three-month notice periods are common, track offer-to-join ratio separately from offer acceptance, or accepted candidates who never join stay hidden.
- 5A first dashboard needs only 6 to 8 numbers from ATS dates. HireBound data shows a 64% WhatsApp response rate in India against about 12% for email.
Recruitment metrics are the numbers a hiring team uses to measure how fast, how cheaply and how well it fills roles. The 12 that matter most are time to fill, time to hire, cost per hire, source of hire, response rate, stage conversion, interview-to-offer ratio, offer acceptance, offer-to-join ratio, quality of hire, first-year retention and candidate NPS.
Most teams already hold the raw data. Stage dates sit in the ATS and spend sits with finance. What is usually missing is a fixed definition for each number and a habit of reading them together.
Below, each metric gets a definition, a formula and a note on when it matters, with a link to a deeper post where one exists. The guide ends with recruiter KPIs and a simple dashboard.
See how connected sourcing, outreach and pipeline tracking feed these numbers: explore HireBound's AI recruiting platform.
What Are Recruitment Metrics?
A recruitment metric is a measurement of one part of the hiring process, calculated the same way every period. Time to fill, for example, counts calendar days from requisition to accepted offer. A KPI is a metric you have chosen to set a target against.
A team can measure 30 things but only chase three or four targets at once. Treat the 12 below as your measurement set and pick a handful as KPIs each quarter.
Recruitment metrics fall into four groups:
- Speed and cost: how long hiring takes and what it costs.
- Funnel: where candidates come from and where they stall.
- Offer and joining: whether accepted offers turn into first days.
- Outcomes: whether the people you hired were the right ones.
Speed and cost numbers are ready the day a role closes, while outcome numbers take 6 to 12 months. Teams that report only the first group miss whether the hires worked out.
The 12 Recruitment Metrics at a Glance
Here are all 12 recruitment metrics with the formula and the question each one answers.
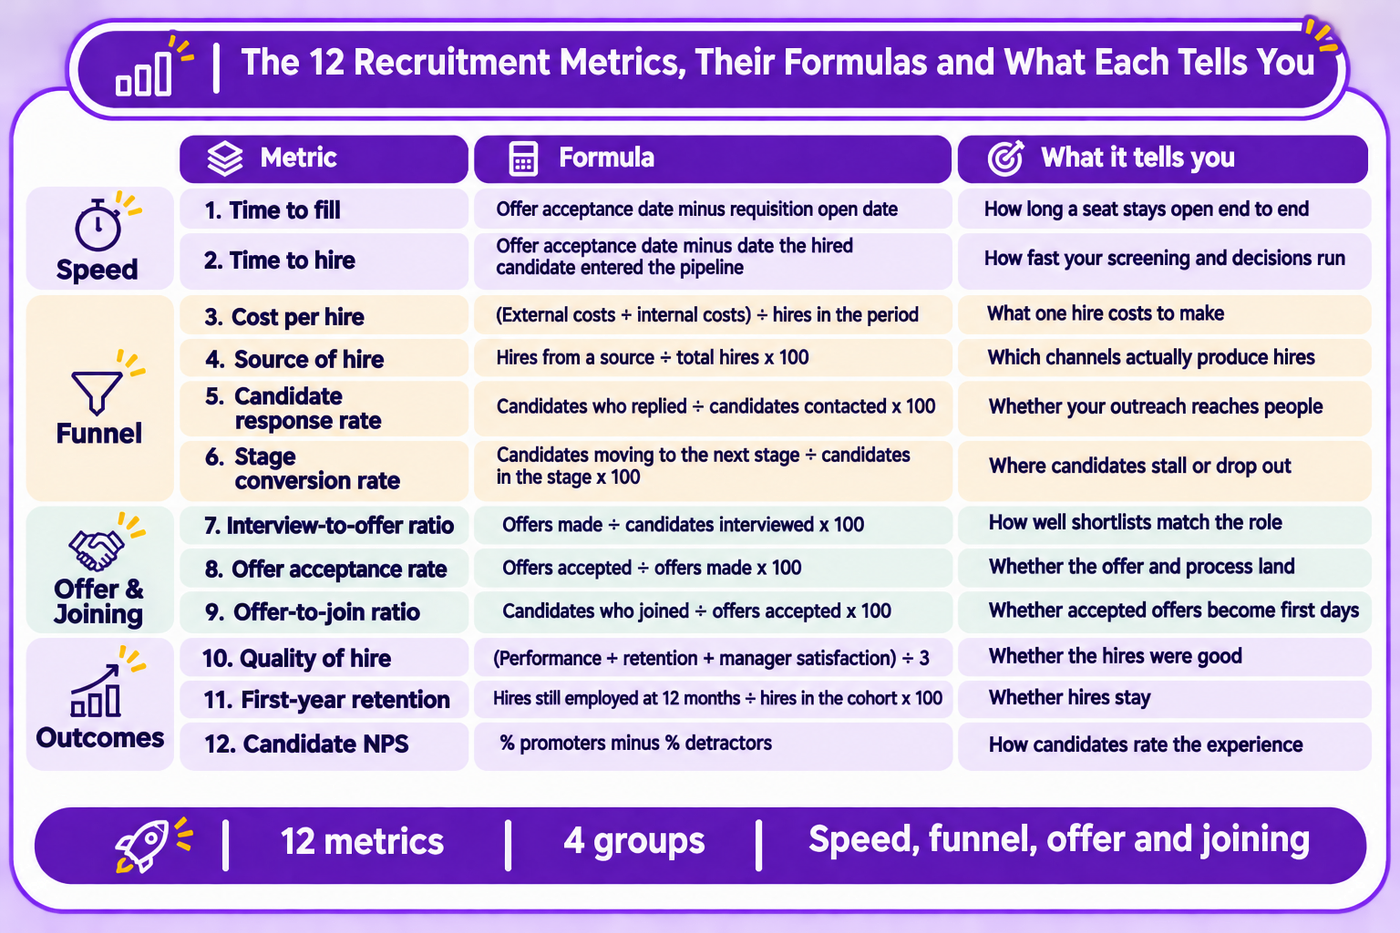
The sections below explain when each metric earns a place on your dashboard.
Speed and Cost: How Fast and How Expensive Is Your Hiring?
Leadership asks for these three first. They are easy to calculate and easy to misread.
1. Time to fill
Time to fill counts calendar days from requisition opening to offer acceptance. It includes the days before sourcing starts.
SHRM's 2026 Recruiting Executives Benchmarking, drawn from more than 4,600 organisations, puts the median at 39 calendar days for nonexecutive roles. Use it when you plan headcount or explain to a hiring manager how long a seat will stay empty. Our time-to-hire benchmarks by role and industry break that median down further.
2. Time to hire
Time to hire starts on the day the eventual hire enters your pipeline, by applying or being sourced, and ends at offer acceptance. It isolates the speed of your screening, interviews and decisions.
Read the two together. A long time to fill with a short time to hire means the delay sits upstream, in approvals or a slow start to sourcing. A long time to hire points to scheduling gaps, too many rounds or slow feedback.
3. Cost per hire
Cost per hire is total recruiting spend in a period divided by the hires made in that period. The SHRM/ANSI standard splits spend into external costs, such as job boards, agency fees and background checks, and internal costs, such as recruiter pay and interviewer time.
SHRM's 2025 benchmarking, based on 2,371 members, reports an average of $5,475 for nonexecutive roles and $35,879 for executive roles. They are US averages, useful as a sense check. Our cost per hire guide has a worked example and the India-specific cost lines, such as agency fees tied to CTC and notice-period buyouts.
Funnel Metrics: Where Do Candidates Come From and Where Do They Stall?
Funnel metrics move week to week, so they give the earliest warning. A drop in response rate today shows up as a slower time to fill next month.
4. Source of hire
Source of hire is the share of hires that came from each channel: referrals, job boards, agencies, your career page, sourcing or rediscovered past applicants. Count hires, not applicants. A board that sends 2,000 applications and two hires is a different channel from one that sends 200 and ten.
Pair it with cost per hire and quality of hire by source at budget time, and you know which channels to fund.
5. Candidate response rate
Response rate is the share of contacted candidates who reply. Every number below it in the funnel depends on it.
Channel moves this metric more than message copy does. HireBound data from India shows a 64% response rate on WhatsApp against about 12% for email. If most of your first contact goes by email, check response rate by channel before you rewrite a single template.
6. Stage conversion rate
Stage conversion is the share of candidates who move from one stage to the next, such as screened to interviewed. Calculate it for every transition.
A sudden drop at one stage points to a specific cause. A drop between screening and interview often means slow scheduling. Separate the candidates you rejected from those who stopped replying, because they are different problems.
7. Interview-to-offer ratio
Interview-to-offer ratio is the share of interviewed candidates who receive an offer. It reads shortlist quality. If hiring managers interview eight people for every offer, the screen is letting through candidates who do not fit.
Track it per hiring manager. One manager with a much lower ratio than peers may have an unclear brief, which an intake meeting can fix.
Offer and Joining: Do Accepted Offers Turn Into First Days?
In India, the stretch from offer to first day is where many teams lose candidates they had counted as hired. Two metrics cover it.
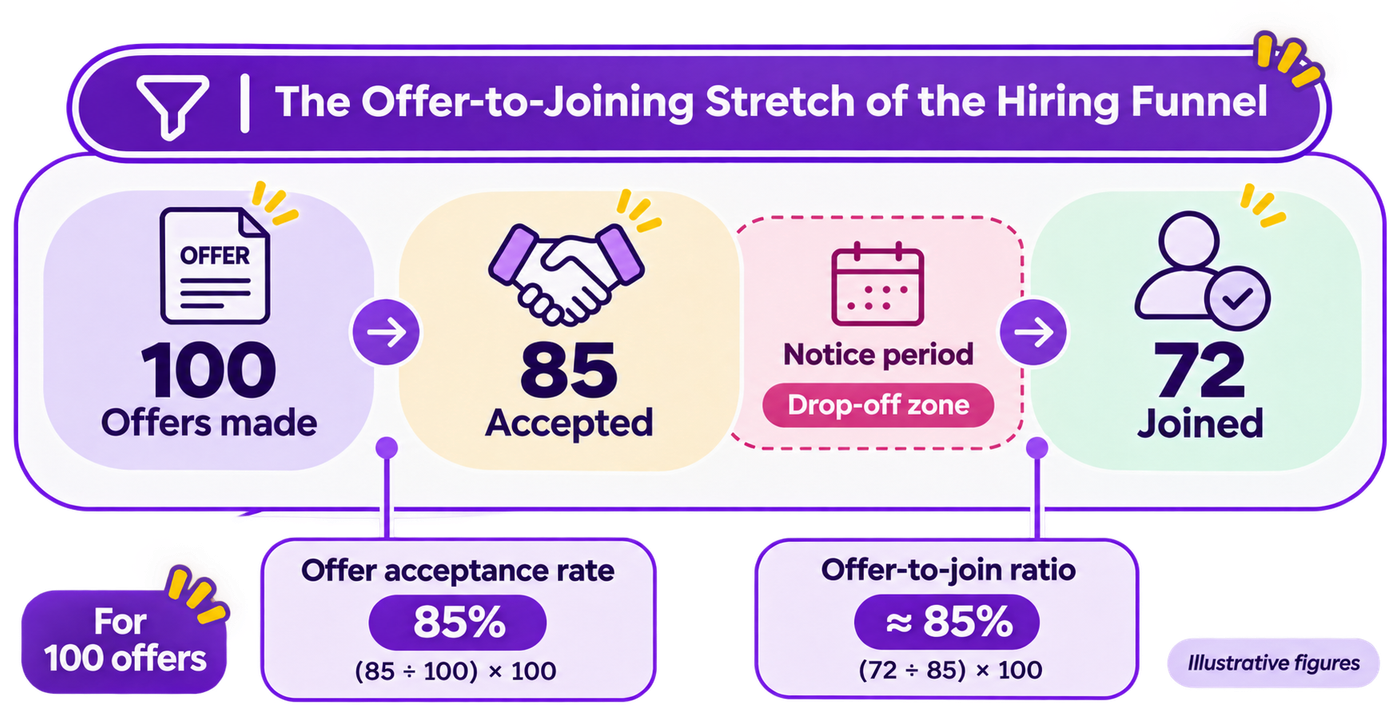
In this illustrative example, 100 offers produce only 72 joiners, and most of the loss happens after acceptance.
8. Offer acceptance rate
Offer acceptance rate is the share of offers made that candidates accept. It reflects how well the offer matched what was discussed and how the candidate felt about the process.
If it falls, check the gap between final interview and offer first, since candidates cool quickly. Then check whether pay, location and start date were confirmed before the offer went out.
9. Offer-to-join ratio
Offer-to-join ratio is the share of candidates who accepted an offer and then actually joined. In India it deserves its own line on the dashboard.
Notice periods of one to three months are common in Indian IT and corporate roles. That leaves a long window in which an accepted candidate can keep interviewing, take a counter-offer or simply stop replying. Track notice-period drop-off as a sub-metric: accepted candidates who withdraw before day one, divided by offers accepted.
ManpowerGroup's Employment Outlook Survey for Q4 2026 put India's Net Employment Outlook at 54%, based on 3,055 employers, the strongest hiring outlook in the survey. In a market like that, candidates on notice often hold more than one offer. Regular contact during the notice period, such as a check-in every week or two, is a practical lever.
Outcome Metrics: Were They the Right Hires?
Outcome metrics take months to settle, which is why many teams skip them. They are the only metrics that show whether the hires were good.
10. Quality of hire
Quality of hire combines three or four indicators into one score per hiring cohort. A common version averages performance rating, 12-month retention and hiring manager satisfaction, each converted to a 0 to 100 scale.
For example, a cohort of 50 hires with an average performance score of 78, 84% retention at 12 months and manager satisfaction of 82 scores (78 + 84 + 82) ÷ 3 = 81. The score only means something in comparison, such as this quarter against last or one source against another. Our guide on how to measure quality of hire covers weighting and where the data comes from.
11. First-year retention
First-year retention is the share of a hiring cohort still employed 12 months after joining. Many teams also track 90-day attrition, which catches mismatches in role, pay or manager faster.
A hire who leaves in week six usually points to the job description, the screen or onboarding. One who leaves in month eleven is more often about the manager or the market.
12. Candidate NPS
Candidate NPS asks one question: how likely are you to recommend applying here to a friend, on a 0 to 10 scale? Subtract the share of detractors (0 to 6) from the share of promoters (9 or 10).
Send it to rejected candidates too, not only to hires. For high-volume employers screening thousands of people a month, those candidates are also future applicants, referrers and customers.
Recruiter KPIs: Which Metrics Measure the Recruiter, Not the Process?
Recruiter KPIs measure one person's or one desk's output, while the 12 metrics above measure the hiring system. Mixing the two leads to unfair reviews, since a recruiter cannot fix a hiring manager who takes ten days to give feedback.
The recruiter KPIs worth tracking are:
- Open requisitions per recruiter: the workload behind every other number. SHRM's 2026 benchmarking found median requisitions per recruiter rose 67% in extra-large organisations.
- Time to shortlist: days from intake meeting to the first qualified shortlist.
- Submittal-to-interview ratio: the share of submitted candidates the hiring manager chooses to interview.
- Hires or placements per recruiter per quarter: output, read alongside workload.
- Hiring manager satisfaction: a short survey after each closed role.
Read output against workload: four hires from 35 open roles is a different result from four hires out of 12. Staffing agencies add a wider set of KPIs covering revenue, margin and client health.
How to Build a Simple Recruitment Metrics Dashboard
A first recruitment metrics dashboard can live in a spreadsheet. One row per candidate with the right date columns covers most of the 12 metrics.
- Fix the definitions. Write one line for each metric, including when the clock starts and stops. Use calendar days, and report the median as well as the average.
- Record the dates. Requisition opened, candidate entered, each stage change, offer made, offer accepted, joined. Every speed and funnel metric is a calculation on these dates.
- Add three fields. Source, hiring manager and role family. These let you split every number, which is where the useful findings are.
- Pick a cadence. Review funnel metrics weekly, speed and offer metrics monthly, and cost and outcome metrics quarterly.
- Show the trend. Put the last three periods next to the current one.
- Assign an owner per metric. Each number on the dashboard needs a person who explains movement and proposes a fix.
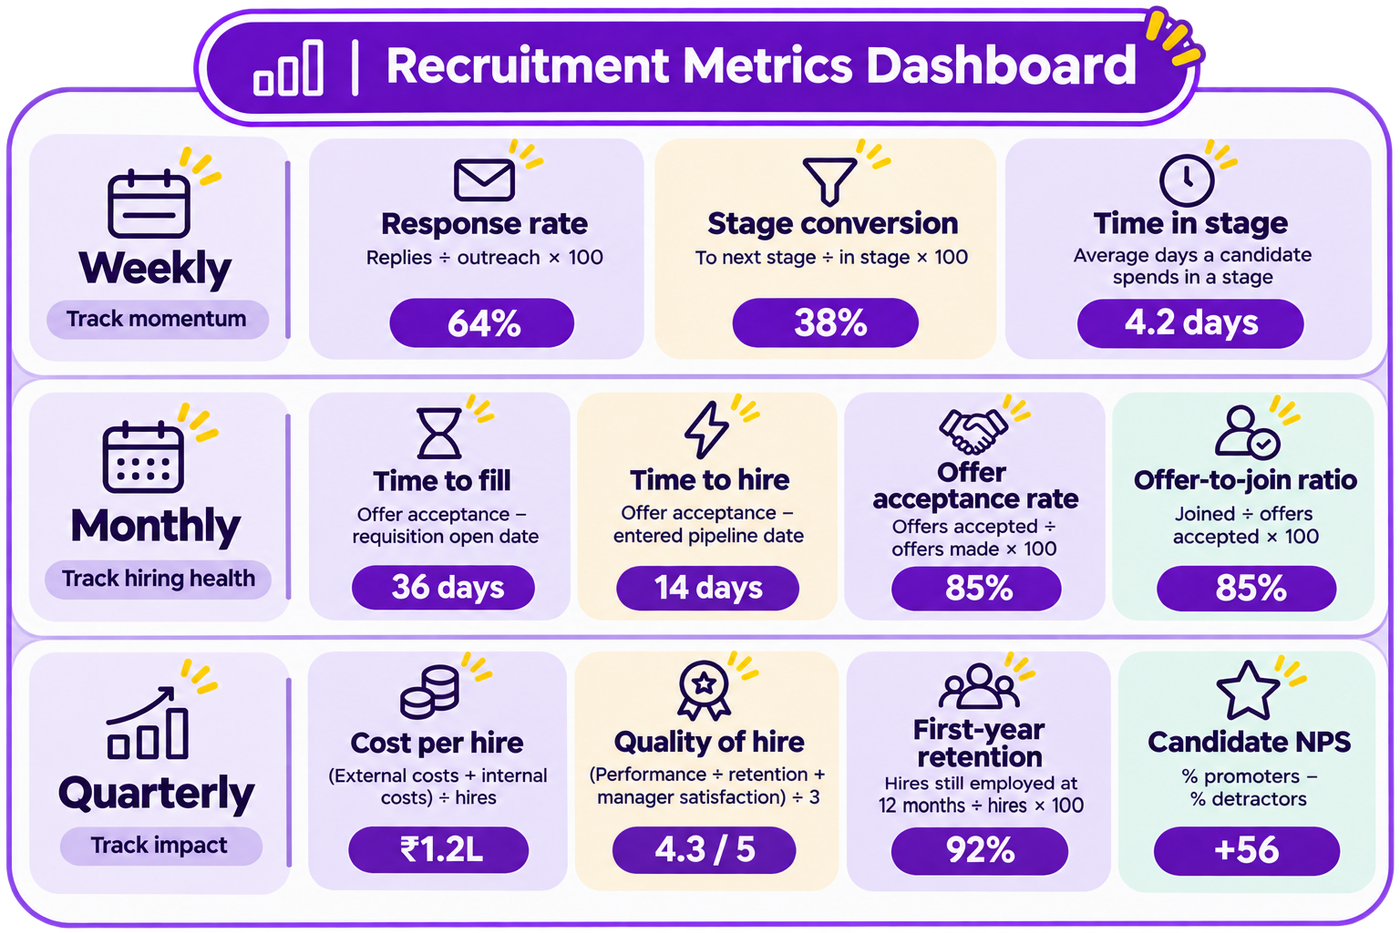
Grouping the dashboard by review cadence keeps the weekly meeting short and the quarterly review focused on outcomes.
Start with six to eight numbers, not all 12. A good first set is time to fill, time to hire, response rate, stage conversion, offer acceptance and offer-to-join. Add cost and quality once the date data is clean.
Which Recruitment Metrics Mislead Teams Most Often?
Most mistakes come from how a metric is read. Four patterns are common:
- Speed without quality. Time to hire falls while 90-day attrition rises. Always pair a speed metric with an outcome metric.
- One company-wide average. A blended time to fill mixes a two-week frontline hire with a three-month engineering search. Split by role family.
- Changing definitions. Cost per hire that includes agency fees one quarter and leaves them out the next cannot be trended.
- Counting applicants, not hires. Source reports built on application volume reward the noisiest channel.
Where HireBound Fits
Most of the 12 recruitment metrics depend on clean stage dates and full communication history. Those records go missing when screening and follow-up happen across personal phones and inboxes.
HireBound's Smart CRM logs agent activity and moves candidates through pipeline stages automatically, with an attributed activity log. Its Real-Time Dashboard shows pipeline, AI call statistics and candidate stages.
HireBound's Screening and Scheduling Agents run outreach over Voice, WhatsApp, SMS and email and book interviews, so response rate, stage conversion and time in stage are recorded as the work happens. Unified inbox replies sit on the candidate profile, which helps when you check in with candidates during a notice period.
Recruiters still own the decisions behind the numbers: who to shortlist, how to close an offer, and what to change when a metric moves. Across India, 60+ recruiting teams run their pipelines on HireBound. For corporate teams, HireBound's recruitment software for in-house hiring teams covers sourcing through scheduling for permanent roles.
Want your recruitment metrics to come from the pipeline itself, not a monthly spreadsheet rebuild? Talk to the HireBound team.
What Should You Track This Month?
Pick the six starter metrics, write their definitions down, and pull the last two quarters from your ATS as a baseline. Then choose the one number furthest from where you want it.
For most Indian hiring teams, that is offer-to-join ratio or response rate. Both are fast to measure, and both move within weeks once you change the channel or the follow-up rhythm.


