Candidate Experience Metrics: NPS, CSAT, and What to Track Beyond Time-to-Hire
 Suvam Moitra
 ·Oct 13, 2026·11 min read
Key Takeaways
- 1Talent Board’s 2024 CandE research put candidate resentment in North America at 15%, the highest it had recorded, so a poor process now costs you future applicants and referrals.
- 2Candidate NPS measures the relationship and CSAT measures a single stage. Use NPS at the end of the process and CSAT at each handoff.
- 3Behavioral data such as drop-off rate and response lag needs no survey and often shows problems weeks before survey scores move.
- 4Short surveys sent at the moment of a decision get the most replies. Keep them to three questions and ask rejected candidates too.
- 5Short surveys sent at the moment of a decision get the most replies. Keep them to three questions and ask rejected candidates too.
Candidate experience metrics are the measurements that show how job seekers feel about your hiring process and where they abandon it. They include survey scores such as candidate NPS and CSAT, plus behavioral signals such as drop-off rate and response lag. Together they cover what candidates say and what they do.
Most teams track time-to-hire and cost-per-hire and stop there. Those numbers describe your speed and spend. They say nothing about the person on the other side, who may have waited nine days for a reply and quietly taken another offer.
This guide shows what to measure, how to calculate each number, and what to do with the results.
Want candidate experience data without building surveys by hand? See how HireBound automates candidate conversations →
What Do Candidate Experience Metrics Actually Measure?
Candidate experience metrics measure three different things, and mixing them up is the most common mistake.
The first is sentiment: how candidates rate the process, the recruiter, and your company. Candidate NPS and CSAT live here. The second is behavior: what candidates do, such as finishing an application, showing up to an interview, or going silent. The third is outcome: what the experience produces, such as offer acceptance rate and the share of past candidates who reapply or refer someone.
Sentiment tells you how people felt, behavior tells you where they left, and outcome tells you what it cost.
Time-to-hire is a process metric. A fast process can still feel dismissive, and a slow one can feel fine if people are kept informed, so speed alone is a weak proxy for experience.
In Talent Board’s 2024 CandE Benchmark Research, candidate resentment reached 15% in North America, the highest the study had recorded. Resentment here means the share of candidates who disengage from an employer after a poor hiring experience. They stop reapplying, stop referring others, and in consumer-facing businesses may stop buying.
For high-volume employers in India, the effect compounds. A BPO or retail chain that screens thousands of people a month creates thousands of former candidates who talk about how they were treated. Our post on why candidates drop off during hiring covers what pushes people out at each stage.
How Do You Calculate Candidate NPS and What Is a Good Score?
Candidate NPS is the Net Promoter Score adapted for hiring. You ask one question: “How likely are you to recommend applying to our company to a friend or colleague?” Candidates answer on a scale from 0 to 10.
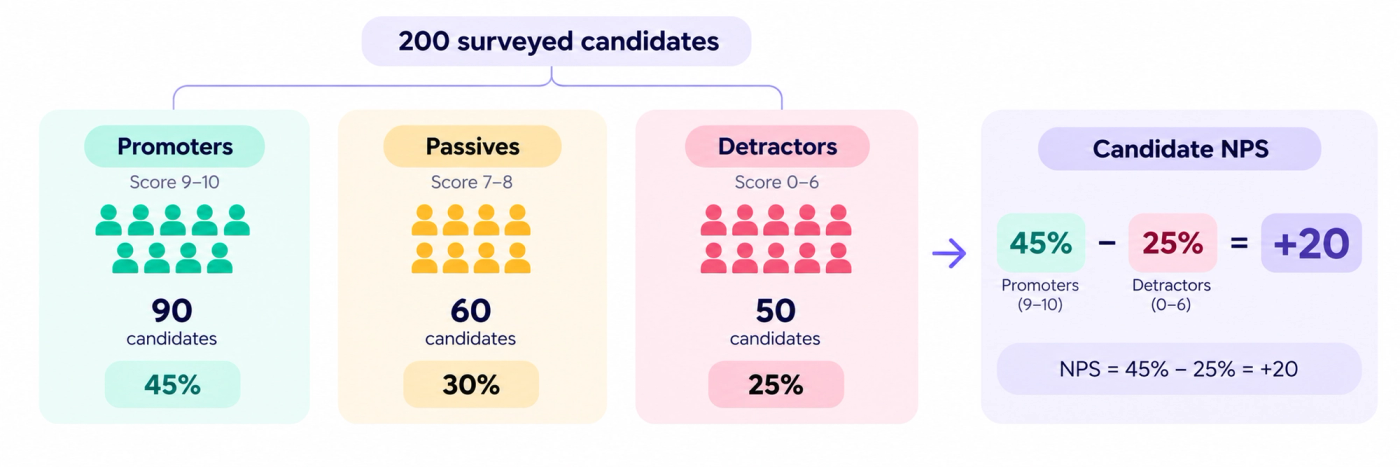
Sort the answers into three groups.
- Promoters: scores of 9 or 10.
- Passives: scores of 7 or 8. They are ignored in the calculation.
- Detractors: scores of 0 to 6.
Then subtract the share of detractors from the share of promoters. The result is a number between -100 and +100.
Here is a worked example. You survey 200 candidates. 90 give a 9 or 10, 60 give a 7 or 8, and 50 give 0 to 6. Promoters are 45% and detractors are 25%. Your candidate NPS is +20.
What Counts as a Good Candidate NPS?
There is no single agreed threshold, so treat outside numbers as context and not as a target. Talent Board’s 2025 research reported that winners of its CandE awards posted an NPS of 52 at the research and attract stage in North America, against 38 for all participating companies. That is a gap of 14 points between employers recognized for candidate experience and the general field.
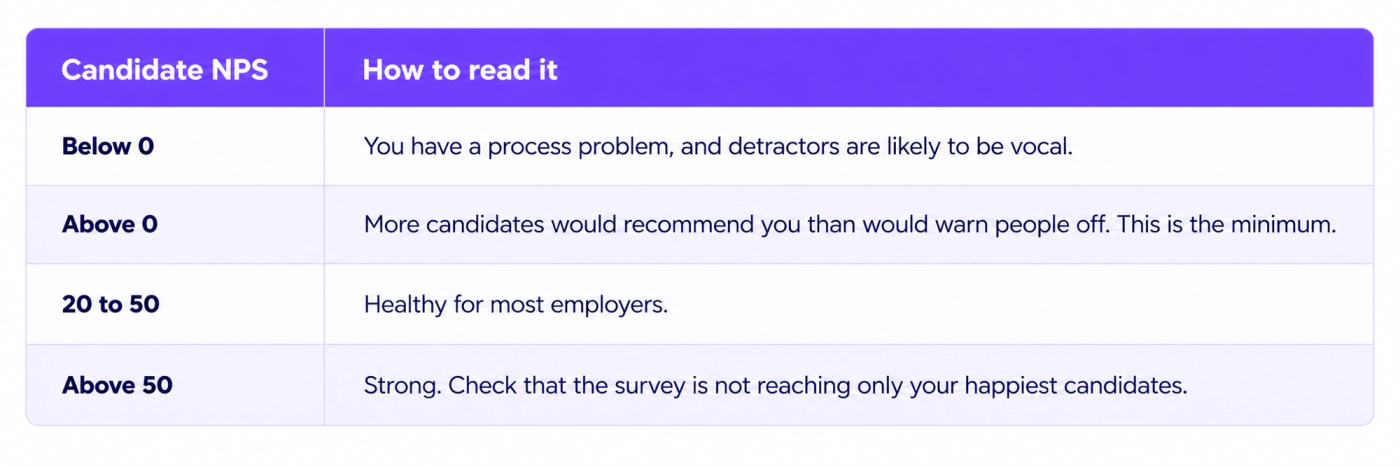
These bands are rule-of-thumb guidance, not an industry standard. One way to read your own data:
The most useful number is your own trend over time and by candidate group. Track NPS separately for candidates who were hired, rejected after an interview, and rejected at screening. Rejected candidates are the group most teams never ask, and they are the ones who tell you the truth.
Where Candidate NPS Falls Short
NPS is one number that hides a lot. It does not say why people scored you low. It also shifts with the mix of candidates you surveyed. If most of your responses come from people who were hired, the score will look better than reality.
Always pair the score with one open-ended question so you can see the reason behind it.
What Is Candidate CSAT and How Does It Differ From NPS?
CSAT stands for customer satisfaction score. In hiring it measures how satisfied a candidate was with one specific interaction, such as the phone screen, the interview, the assessment, or the offer conversation.
The question is direct: “How satisfied were you with [this step]?” Candidates rate on a scale of 1 to 5. CSAT is the percentage who answer 4 or 5.
For example, if 80 of 100 candidates rate the interview scheduling experience at 4 or 5, your scheduling CSAT is 80%.
The difference between the two is scope and timing.
- NPS measures the overall relationship and loyalty. You ask it once, near the end of the process, and it predicts whether people will recommend you.
- CSAT measures a single moment. You ask it right after that moment, and it tells you which step to fix.
Use both. NPS tells you whether you have a problem. CSAT by stage tells you where it is.
Other Survey-Based Metrics Worth Tracking
A few other survey measures earn their place if your volume supports them.
- Candidate Effort Score: asks how easy it was to complete a step, such as applying or booking an interview. Effort matters a lot in mobile-first, high-volume hiring, where a clunky form ends the application.
- Perceived fairness: asks whether the candidate felt assessed fairly. Talent Board’s 2025 research found CandE winners scored 23% higher on perceived fairness of assessments and 13% higher on fairness of interviews than all employers.
- Clarity of communication: asks whether the candidate always knew what would happen next.
- Likelihood to reapply or refer: a direct outcome question that links experience to future pipeline.
You do not need all of these. Two or three well-chosen questions beat a survey that asks about everything.
Which Behavioral Metrics Signal Experience Problems?
Behavioral metrics come from your system data and need no survey. That makes them useful for two reasons. Every candidate is included, not just the few who reply, and they show problems as they happen instead of weeks later.
Stage-by-Stage Drop-Off Rate
Drop-off rate is the share of candidates who leave between one stage and the next. Calculate it for each transition: applied to screened, screened to interviewed, interviewed to offered, and offered to accepted.
A sudden jump at one stage points to a specific cause. A high drop after the application form suggests the form is too long. A drop between screening and interview scheduling often means slow follow-up. A drop after the offer can point to pay, notice-period handling, or silence from the recruiter.
Separate voluntary exits from rejections. A candidate who stops responding is a different signal from a candidate you rejected.
Response Lag
Response lag is the time between a candidate’s action and your reply. Measure it at each handoff: application to first contact, interview to feedback, final interview to decision.
Talent Board’s 2025 data shows why this matters. It found that 69% of participating employers aimed to give candidates a disposition (a clear yes or no) within one to two weeks, and that 60% of the top ten North American CandE winners did so within three to five days. North American winners also had 61% fewer candidates waiting two or more months for next steps after applying.
Set your own service levels and measure against them. For example, first contact within 24 hours of applying and a decision within five working days of the final interview.
Ghosting and No-Show Rates
Track two more numbers. Candidate no-show rate is the share of scheduled interviews that candidates skip. Candidate ghosting rate is the share of candidates who stop replying mid-process.
Both are behavioral proof of a weak experience. In high-volume hiring in India, they are often driven by channel mismatch as much as by disinterest. HireBound data shows a 64% WhatsApp response rate in India, compared with about 12% for email. If your first contact goes by email, a large part of your “ghosting” may simply be messages that were never read.
Offer Acceptance Rate and Reapply Rate
These are outcome metrics. Offer acceptance rate tells you whether the experience held up to the end. Reapply rate, the share of rejected candidates who apply again within a year, tells you whether you left the door open.
The link to your budget is direct. A worse experience lengthens the process and loses good candidates late, which raises the cost of every failed hire. Scheduling is one of the easiest places to lose people, and our comparison of self-scheduling and recruiter-scheduled interviews shows how it affects no-shows. The quality of hire metric is the natural companion to experience measures.
How Do You Build a Candidate Feedback Survey That Gets Responses?
A candidate feedback survey gets responses when it is short, timely, and clearly useful. Most surveys fail on the first of those, and the fix is simple. Send three questions or fewer.
Follow these steps.
- Pick the trigger. Send the survey right after a decision, not weeks later. Good moments are after the application is submitted, after the interview, and after the outcome is communicated.
- Ask three questions. One rating question (NPS or CSAT), one “what could we have done better?” open question, and one question about clarity of communication.
- Use the channel candidates already use. For frontline and high-volume roles, a WhatsApp message with tap-to-reply options fits the way people already communicate. For professional roles, a short email link works.
- Keep it under two minutes. State the time in the message, for example “3 quick questions”.
- Survey rejected candidates too. Rejected candidates are the largest group and the most honest one. Ask them the same questions, with the same speed.
- Make it anonymous or say how you use it. Candidates answer more openly when they know the answer will not affect a future application.
- Close the loop. Tell candidates a change was made because of feedback. Response rates rise over time when people see that surveys lead somewhere.
On sampling, do not survey only the people you hired. That gives you a flattering picture and a few dozen responses. If the volume allows, survey every candidate at a set stage and check that the responses cover both hired and rejected groups.
What Are the Consent and Data Rules in India?
A candidate survey collects personal data, so it falls under India’s Digital Personal Data Protection Act, 2023. Tell candidates what you are collecting and why, keep the survey optional, and do not keep identifiable responses longer than you need them. If you plan to keep survey data attached to a candidate record, say so in the message. Have your counsel confirm the retention period.
How Do You Turn Candidate Feedback Into Process Changes?
Feedback becomes useful only when someone owns it and something changes. A simple routine works better than a large program.
- Review on a schedule. Look at the numbers monthly for the first quarter and quarterly after that. Look at scores by stage, by role family, and by candidate group (hired, rejected after interview, rejected at screening).
- Find the worst stage. Compare CSAT and drop-off across stages. The stage with the lowest score and the biggest exit is your first target.
- Read the open-text answers. Group comments into themes: slow replies, unclear next steps, long forms, unprepared interviewers, rude tone. Count how often each theme appears. Repeated themes matter more than vivid single comments.
- Change one thing at that stage. Do not fix everything at once, or you will not know what worked. If the theme is silence, set a reply deadline. If it is a long form, cut the fields. If interviewers seem unprepared, give them the scorecard and the CV a day before.
- Re-measure. Compare the same metric before and after, over at least a full hiring cycle.
- Tell candidates what changed. Even a short note to the hiring team or a line in your career page builds trust.
Feedback to candidates matters as much as feedback from them. Talent Board’s 2025 research found that CandE winners gave 20% more feedback to finalists than all other companies combined, and that when candidates received specific feedback, their willingness-to-refer NPS rose 69%.
A Worked Example
Picture a logistics company hiring warehouse associates in volume. Its candidate NPS is negative and many candidates vanish between screening and interview. CSAT by stage shows scheduling scores far below every other step, and open-text comments repeat the same complaint: “no one called back with a time.”
The team changes one thing. Interview slots are offered inside the same WhatsApp conversation as the screening, with a reply deadline of two hours. After one quarter, they compare scheduling CSAT and screening-to-interview drop-off against the previous quarter. This is a simple before-and-after test that any team can run.
Should You Track Every Metric?
No. Start with a short list and add only when a metric changes a decision.
A sensible starting set has six numbers:
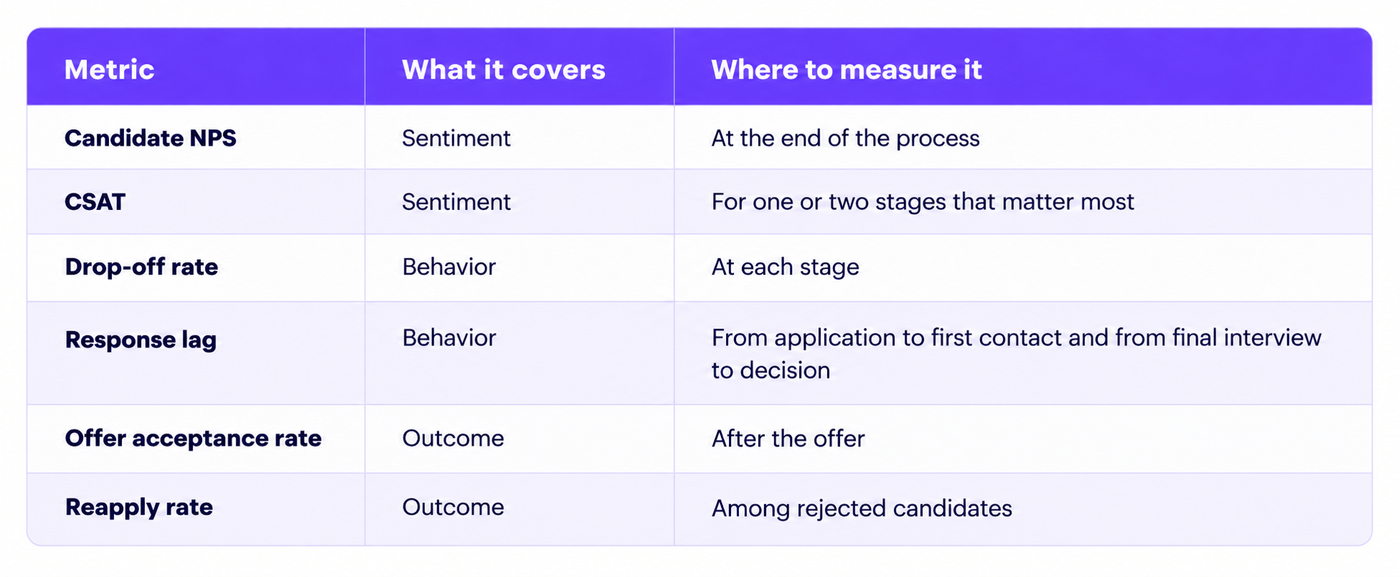
These are enough to tell you where you stand and where to act. If you have high volume and a good data setup, add effort score and no-show rate. If you run a small team with a handful of hires a quarter, NPS plus a stage-by-stage conversation with a few candidates gives you more than a dashboard would.
Survey scores are self-reported and skew toward people with strong opinions. Behavioral data does not say why someone left. Benchmark figures from other employers come from different industries, countries, and hiring volumes, so treat them as context. The reliable comparison is your own data, quarter on quarter.
Ready to see candidate experience improve, not just get measured? Book a free demo →
Start with one role family you hire for often. Add a three-question survey after the interview and after the decision, track drop-off by stage, and review after 60 days. That single loop will show you where candidates are having a bad experience, and it will give you a fix to try.


