India Job Market in 2026: Where Hiring Stands and What It Means for Recruiters
 Suvam Moitra
 ·Nov 1, 2026·8 min read

Key Takeaways
- 1MoSPI’s PLFS put India’s unemployment rate at 5.0% in September 2026, down 0.2 points from a year earlier, with participation at 55.5%.
- 2PLFS put unemployment for people aged 15 to 29 at 15.2% in September 2026, three times the overall rate, so fresher and experienced supply differ.
- 3RBI’s August 2026 Bulletin showed regular salaried employment rising from 25.5% to 26.2% in Q1 2026-27, even as unemployment rose to 5.4%.
- 4Nasscom estimated direct tech employment at about 6 million in FY26, a net addition of only 135,000, so tech hiring is steady rather than surging.
- 5Track the monthly PLFS bulletin, released around mid-month, and set recruiter targets by segment, because one national average hides urban, rural, youth and gender gaps.
The India job market in September 2026 is stable and slightly improving. India’s Periodic Labour Force Survey (PLFS) put the unemployment rate at 5.0% for people aged 15 and above, down 0.2 points from a year earlier. Youth aged 15 to 29 face a much higher rate of 15.2%, so the picture depends on who you are hiring.
If you run hiring at an Indian employer or agency, see how HireBound speeds up candidate response: explore the AI recruiting platform.
Last updated: 1 November 2026. Every figure below was read from the source named in the sentence on that date. Refresh cadence: monthly, within a week of each PLFS monthly bulletin, which usually appears around the middle of the month. The next update follows the October 2026 bulletin.
What Is the State of India’s Job Market Right Now?
The best single source is the PLFS monthly bulletin from the National Statistics Office (NSO), part of MoSPI. It surveys about 3.7 lakh people a month. The September 2026 bulletin, released on 15 October 2026, gives three numbers worth remembering.
- Unemployment rate: 5.0% for people aged 15 and above, down from 5.2% in September 2025.
- Labour force participation rate (LFPR): 55.5%, up 0.2 points from a year earlier.
- Worker population ratio (WPR): 52.7%, up 0.3 points from a year earlier.
All three use the Current Weekly Status method, which counts anyone who worked or looked for work in the previous seven days. The table below sets the September 2026 figures against the same month a year earlier.
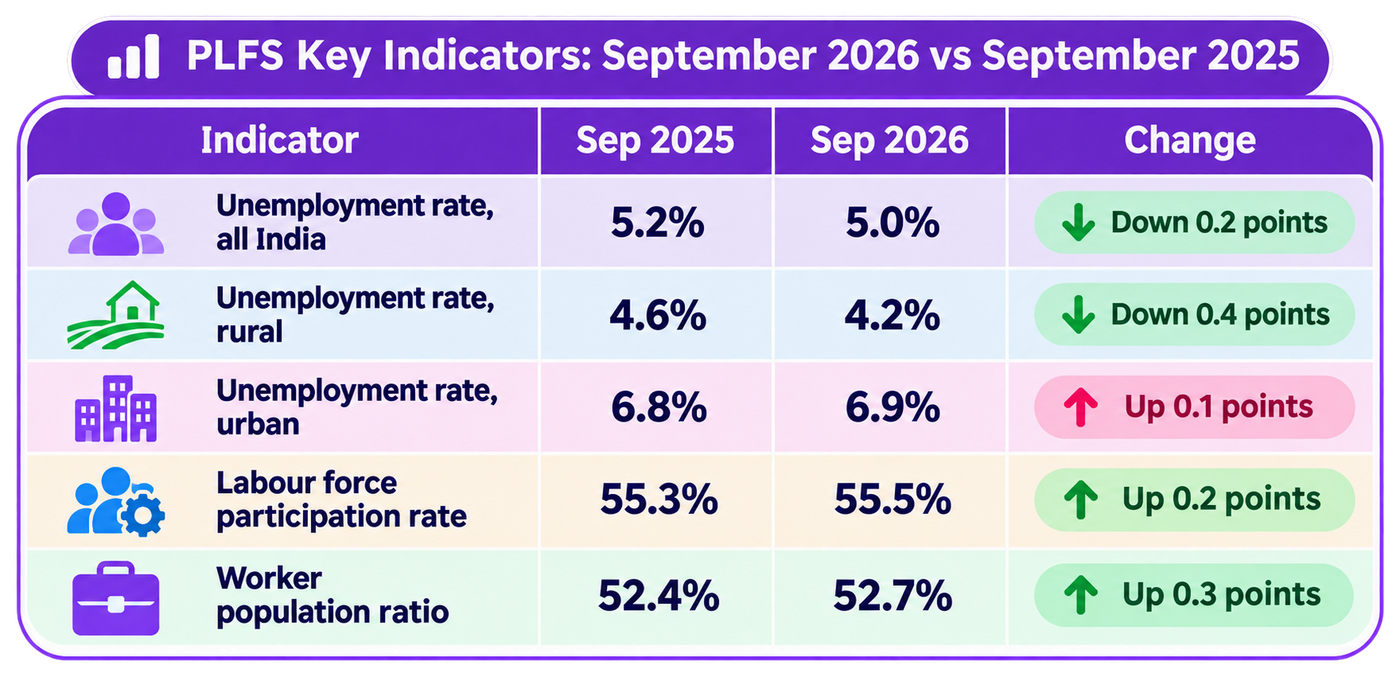
Source: MoSPI PLFS Monthly Bulletin, September 2026, persons aged 15 and above. The September 2025 worker population ratio is the 2026 figure less the 0.3-point rise the bulletin reports.
The takeaway is that rural India is improving while urban India is flat. Urban figures are the closer proxy for office-based roles. Read the PLFS press note for September 2026 for the full tables.
How Have Employment and Unemployment Moved in 2026?
The trend is a soft patch in spring, then a recovery. The Economic Survey 2025-26, published in January 2026, reported unemployment of 4.8% in December 2025 and total employment of 56.2 crore people in July to September 2025. Unemployment then climbed to 5.5% by May 2026.
It stayed at 5.5% in June, fell to 5.1% in July and settled at 5.0% in August and September. In its August 2026 Bulletin, the Reserve Bank of India (RBI) read the April to June quarter as a weaker one. Quoting the PLFS quarterly bulletin, RBI said the unemployment rate rose to 5.4% in Q1 2026-27 from 5.0% in Q4 2025-26. Participation fell to 54.6% from 55.5%.
The quarterly dip and the monthly recovery fit together. The quarterly figure covers April to June, and the monthly readings since July have improved.
PLFS changed its design in January 2025 to publish monthly and quarterly estimates. Compare 2025 and 2026 months with care, and do not stitch them to older annual PLFS figures.
Which Sectors Are Hiring and Which Are Cooling?
Government data covers sectors only loosely, so the answer is a mix of signals. None is a vacancy count, so read each as a direction.
- Regular salaried work is growing. RBI’s August 2026 Bulletin reported that the share of regular salaried employment rose from 25.5% in Q4 2025-26 to 26.2% in Q1 2026-27.
- Secondary and tertiary sectors gained share. The same bulletin shows the secondary sector rising from 25.2% to 26.7% of employment and the tertiary sector from 33.7% to 34.6%.
- Organised manufacturing added jobs. The Economic Survey 2025-26 said Annual Survey of Industries employment rose 6% in FY24, an addition of over 10 lakh jobs.
- Formal payroll coverage has widened. PIB reported in October 2025 that EPFO added over 1.29 crore net subscribers in 2024-25, up from 61.12 lakh in 2018-19.
- Tech hiring is steady, not surging. Nasscom’s Strategic Review 2026 estimated direct tech employment at about 6 million in FY26, up 2.3%, a net addition of 135,000 people. Nasscom’s own chart calls employee growth subdued.
This post does not use EPFO’s 2026 monthly payroll releases, because the EPFO site did not return them when we checked. Use the latest release directly if you need current payroll numbers.
Fresher vs Experienced: Where Is the Candidate Supply?
Supply is not a single number. The PLFS September 2026 bulletin shows how far apart the groups sit.
People aged 15 to 29 had an unemployment rate of 15.2%. For young men it was 14.0% and for young women 18.5%. The overall rate for all ages above 15 was 5.0%. A fresher requisition in India therefore draws far more applicants per job than a lateral one.
Urban women show the widest gap. The urban female unemployment rate was 9.2% in September 2026, against 6.0% for urban men. Female participation rose 0.5 points year on year to 34.6%, so more women are entering the market than a year ago.
For recruiters, this changes the work. Fresher and entry-level roles are a screening and speed problem, because applications are plentiful. Experienced and niche roles are a reach and response problem, because the right person is employed and slower to answer.
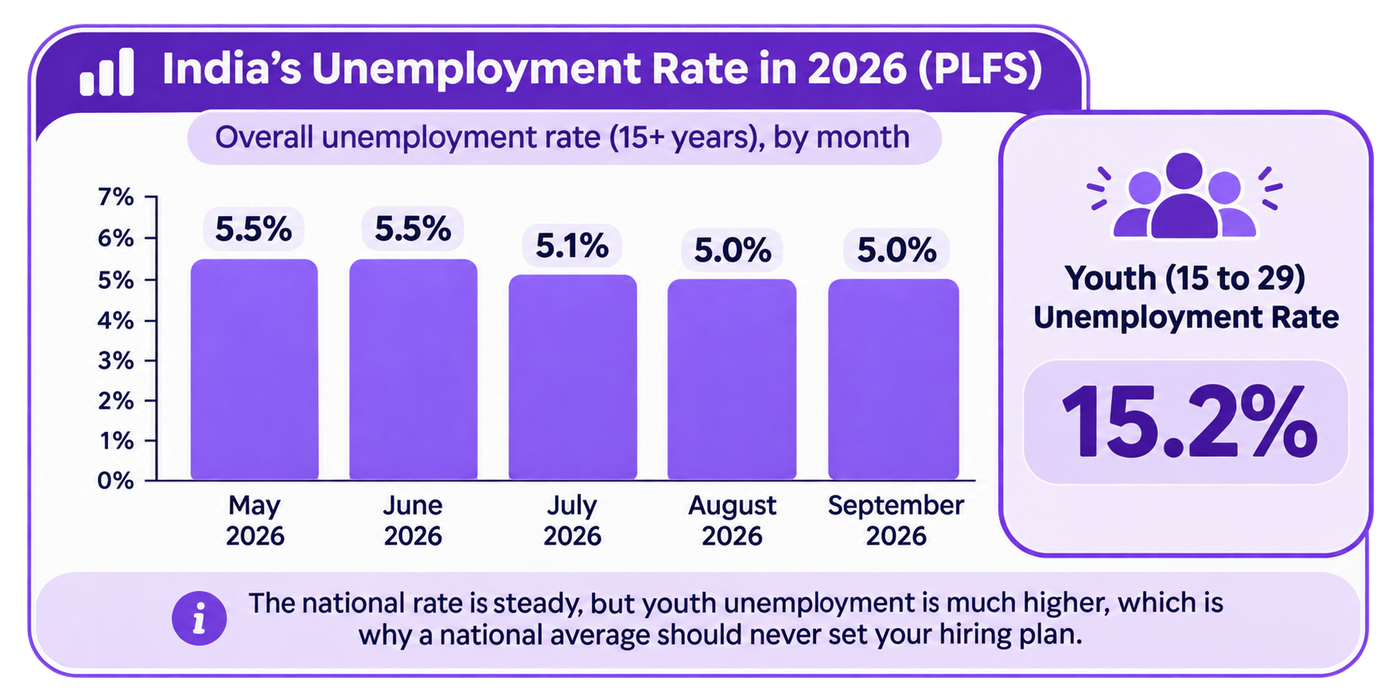
The chart shows a steady national rate with a wide youth gap, which is why a national average should never set your hiring plan.
What Is the Job Market Outlook for the Rest of 2026?
The outlook is for steady conditions with limited upside. The data supports three cautious points, and none is a forecast of hiring volumes.
First, the macro backdrop is positive. The Economic Survey 2025-26 projected real GDP growth of 6.8 to 7.2% for FY27. Second, the July and September PLFS readings improved on spring. Third, RBI’s August 2026 Bulletin noted that PMI employment stayed in expansion, with a notable rise in services.
There are also soft spots. RBI’s bulletin said the quarterly unemployment rate rose, and Nasscom’s tech headcount growth is slow. Applicant volume can rise without vacancies rising, so do not read a fuller inbox as stronger demand.
Plan for stable demand and keep revisiting the plan. If the next bulletins show unemployment drifting up, expect more applicants per role. If it keeps falling, expect slower responses from candidates who already have jobs.
What Does This Mean for Recruiters? Three Actions
Three actions follow from the data.
- Split targets by segment. Set separate response-time and cost targets for freshers and for experienced hires. Use your own benchmarks, such as time-to-hire benchmarks, to see where each segment sits.
- Match recruiter capacity to applicant volume. A fresher drive with a 15.2% youth unemployment backdrop produces more applications than a team can read by hand. See recruiter workload benchmarks for realistic caseloads.
- Watch what each hire costs when supply is loose. Easy supply lowers sourcing effort but not screening effort, so review cost-per-hire benchmarks before assuming savings.
None of the government releases measures offer drop-offs, notice-period lengths or salary pressure. Measure those from your own pipeline. Track offers made against offers accepted and joined, by segment, every month.
How to Track the India Job Market Yourself
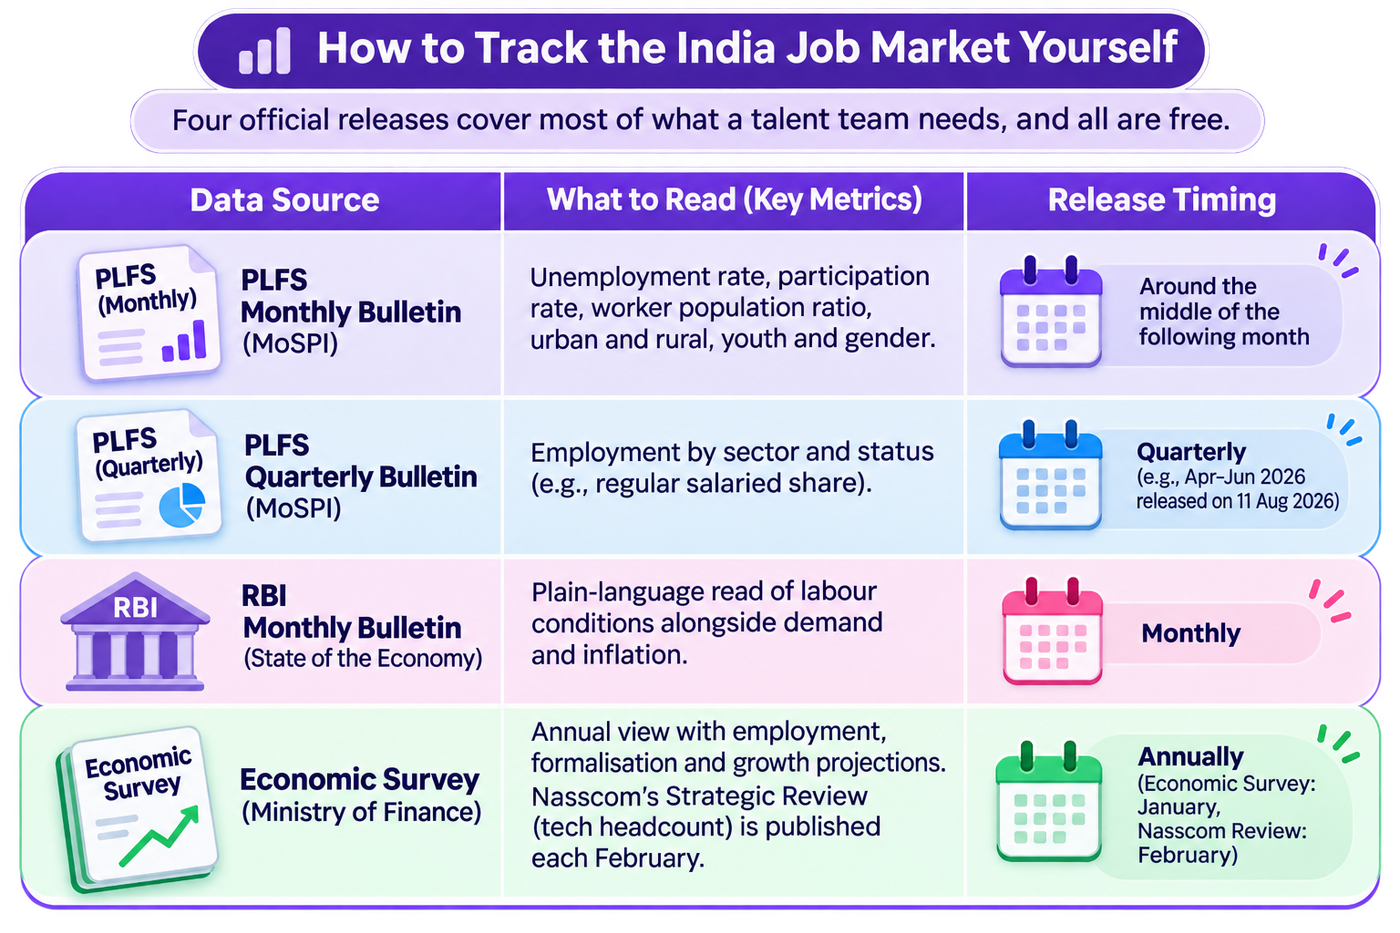
You do not need a vendor index. Four official releases cover most of what a talent team needs, and all are free.
- PLFS monthly bulletin (MoSPI): unemployment rate, participation, worker population ratio, urban and rural, youth and gender. Released around the middle of the following month. The July 2026 note came on 17 August and the September note on 15 October.
- PLFS quarterly bulletin (MoSPI): employment by sector and status, such as regular salaried share. The April to June 2026 edition was released on 11 August 2026.
- RBI Monthly Bulletin, State of the Economy article: a plain-language read of labour conditions alongside demand and inflation.
- Economic Survey (Ministry of Finance): the annual view, published in January, with employment, formalisation and growth projections. Nasscom’s Strategic Review, published each February, adds tech headcount.
Read the headline, then open the table by age group and sector. Save each month’s figures in a sheet so you can plot your own trend.
Where Does HireBound Fit in a Stable but Uneven Market?
The market data points to two problems that software can ease: reaching candidates fast, and screening large applicant pools consistently. For fresher and high-volume roles, the volume problem dominates. For experienced roles, response time does.
HireBound is an AI recruiting platform built for Indian hiring. Its WhatsApp recruiting software reaches candidates on the channel they answer. HireBound’s India figures show a 64% WhatsApp response rate against about 12% for email. Voice AI screening runs in 14 Indian languages, which helps where applicants prefer Hindi or a regional language.
Recruiters using HireBound handle 3× more candidates per day than with a manual process, and the platform has powered 8M+ candidate conversations. A human reviews the shortlist, and recruiters make every hiring decision. The software does not guarantee hires or outcomes.
Planning hiring against a market that looks stable on average and uneven by segment? See how HireBound handles outreach and screening: talk to the HireBound team.
What the Data Cannot Tell You
National figures cannot tell you what a specific role in a specific city will do. The PLFS counts people, not vacancies, and it does not report time to fill or offer acceptance. Sector detail arrives mostly through quarterly and annual releases, so it lags.
The monthly series is also short, since it began in 2025. Small monthly changes may reflect survey variation, so wait for a trend over several months before changing a plan.
Figures here are as published on 1 November 2026 and may be revised. If a number differs from the live source, trust the live source.


